01 Pages : 1-24
- Akakandelwa, A., & Walubita, G. (2018). Students' social media use and its perceived impact on their social life: A case study of the University of Zambia. The International Journal of Multi- Disciplinary Research, 1-14.
- Bashir, I., Malik, A., & Mahmood, K. (2021). Social media use and information-sharing behaviour of university students. IFLA Journal, 47(4), 481-492.
- Bhanot, S. (2012). Use of social media by companies to reach their customers. SIES Journal of Management, 8(1), 47-55.
- Blumler, J. G., Katz, E., & Gurevitch, M. (1974). Utilization of mass communication by the individual. The uses of mass communications: Current perspectives on gratifications research(s 19), 32.
- Brenner, J., & Smith, A. (2013). 72 Percent of online adults are social networking site users. Washington, DC: Pew Internet & American Life Project.
- Burgess, J., Marwick, A., & Poell, T. (2017). The SAGE handbook of social media: Sage.
- Carr, C. T., & Hayes, R. A. (2015). Social media: Defining, developing, and divining. Atlantic Journal of communication, 23(1), 46-65.
- Chen, R., & Sakamoto, Y. (2013, 7-10 Jan. 2013). Perspective Matters: Sharing of Crisis Information in Social Media. Paper presented at the 2013 46th Hawaii International Conference on System Sciences.
Abstract:
The role of social media in Pakistan has become a favorite domain for researchers in media. In this study, it has been explored that how Facebook is being used as a tool for acquiring protest information. Pakistan, as a country with toppling democracies, religious extremism, sectarian hatred, and a flawed judicial system, has seen many protests to date. Often these protests take the shape of riots or are on the verge of leading to riots. At such a stage, the government, in an attempt to cool down the situation, restricts the media organizations from giving coverage to such protests and riots. This study aims to find the use of Facebook by people as an alternative to acquire protest information. To see how Facebook is replacing mainstream media in case of protest information.
Key Words
Social Media, Facebook, Protests, News, Information, Mainstream Media
Introduction
Social networks like Facebook and Twitter have become important communication platforms for people and brands around the world. In particular, social networks have become the main news channel. Most people no longer come home to listen to the 60-minute news. To keep up with current events, they swipe their phones throughout the day to see the headlines. Latest communication technologies have equipped people with a lot of new ways for sending and receiving information. Social media is one of such technologies that have seen a tremendous increase in usage as a source of information (Pepitone, 2010). According to a Pew report, “people use online social tools to gather information, share stories, and discuss concerns” (Fox, 2011, p. 5). We as individuals have not only changed the way we receive information, but the news networks have also had to change the way they bring information to us. News corporations constantly must adapt. Going back through history, beginning with the printing press, to sound waves and the radio, to television, to the internet, and now to social media. The information is always going to be given and received, but the forum has a way of changing with time and technology.
The role of social media, especially Facebook, cannot be set aside to fuel the flames of political protests in Arab countries known as the "Arab Spring." People uploaded photos and news to inform people about the protests. Facebook as a platform brought people together to protest against tyrants and dictators and incited them, thus testifying to how the virtual media platform acted as the central force behind the "Arab Spring" to shake and overthrow the governments of rulers who had not even dreamed of it.The objective of the study is to know that to what extent is Facebook used for news and information.
To examine the use of Facebook as a source of protest information. And to explore the use of Facebook as an alternative to traditional media for receiving protest information when traditional media is restricted.
Literature Review Social Media use by University Students
Over 70% of teens and young people use at least one website for interpersonal interaction, such as Facebook, Twitter, and WhatsApp. The use of Twitter increased from 8% in 2009 to 13% in 2010, although the use of blogging by young people has decreased (Lenhart, Purcell, Smith, & Zickuhr, 2010). As we all know, social networking sites (SNS) like Facebook are globally used; in fact, around 72% of adult internet users use SNS (Brenner & Smith, 2013). Especially college students are frequent users of SNS (Zickuhr & Madden, 2012). For example, a 2011 Pew report found that more than 80% of surveyed college students were using SNS (Smith, Rainie, & Zickuhr, 2011). Osatuyi (2013) conducted an exploratory survey to investigate the use of social media for sharing information on college students in the US. The survey was conducted online and participated by 122 students. “The study explored four types of shared information, namely sensitive, sensational, political, and casual information, involving five popular social media technologies: social networking sites, microblogging sites, wikis, online forums, and online blogs. The study found that 36.5% of students share information on social networking sites like Facebook”.
Social Media in Pakistan
Social media is penetrating in Pakistan at a very fast rate, with a “17% entrance rate as of January 2020. Practically 76.38 million individuals are Internet clients in the country, and 37 million are active clients of social media”. Strangely, the dominant part (72%) are aged somewhere in the range of 18 and 34 (Datareportal.com, 2020). The Most Popular Social Networking Sites among Pakistanis are Facebook, Twitter, Instagram, and Facebook Messenger (Statcounter, 2020). Bashir, Malik, and Mahmood (2021) conducted a study using a cross-sectional survey of students from the four universities of Faisalabad, Pakistan. To select the exact required number of students, they used quota sampling. The results indicate “the students were using various social media platforms. WhatsApp was the most commonly and frequently used, followed by Facebook and YouTube. Twitter and Snapchat were found to be preferred less among the university students in Pakistan” (Bashir et al., 2021, p. 8).
Methodology
The major focus of this study is to find the relationship between Facebook and political information. The aim is to discover how university students use Facebook to obtain protest information, being an alternate to mainstream print/electronic media. Hence the core intention of the researcher is to find out how is Facebook used as a tool of protest information and how the users (Facebook users) evaluate the truthfulness of provided information. Research or exploration is an amazing strategy for examining physical or social miracles, and generally, all investigators will focus on analyzing and understanding the data. Applied sciences and social sciences are unmistakable in their strategy. Because social miracles are complex and ever-changing, researchers generally use various systems to collect data, such as logical checks, meetings, and review procedures.
In this paper, the researcher used a survey method and shared 200 questionnaires among Islamabad university students who are direct users of online networks and Facebook. Due to the prevailing situation of the COVID-19 pandemic and the universities being closed, it was not possible for the researcher to distribute the questionnaire physically; therefore, the researcher used google forms and shared the questionnaire with the students online, and their response was collected.
Population and Sampling
The population of this study is young university students from Islamabad who use Facebook in their everyday life. A survey of a large population requires a great amount of economic and physical resources, which a university student cannot even think of affording it. Therefore, here comes the magic of sampling. The researcher has applied a simple random sampling method to collect the required data. A total of 200 students from different universities in Islamabad who were direct users of Facebook were opted to respond to the said survey questionnaire. According to Wimmer and Dominick (2013, p. 87), “A sample is the subset of the population that is taken to be the representative of the entire population.” Being the direct users of Facebook, the selected population was easy to be approached by the researcher and was accessible to collect the required data. The researcher was determined to select a bigger population unit for the response, but time and financial constraints became a major obstacle in its way.
The researcher carefully designed a questionnaire consisting of close-ended questions. The questionnaire had questions related to the variables of the study. The questionnaires consisted of research-oriented as well as demographic questions. The survey questionnaire served as a medium of data collection. It was compiled in the English language as all the respondents had a good command of the English language. In the meantime, it was made sure that all the participants were Facebook users and had active Facebook accounts.
Data Analysis
The core purpose of this study was to find out how Facebook is taking a place as a tool for acquiring protest information, especially in the case when traditional media is commanded not to give coverage. It will help in finding out how Facebook is being used by youth to add up their knowledge about protests. A well research-based questionnaire comprising of close-ended questions was designed and shared online as due to the ongoing COVID-19 pandemic, universities were closed, and university students being the population, could not be approached when universities were closed. Google Form as an alternative was used, and the link to the questionnaire was shared online with the selected participants. An amount of 200 questionnaires were shared with the university students from Islamabad, out of which 173 fulfilled the criteria to be analyzed, whereas the remaining 27 were discarded due to misinformation and false information. The response of all the participants was recorded and was analyzed using a computer software called “Statistical Package for Social Sciences” (SPSS).
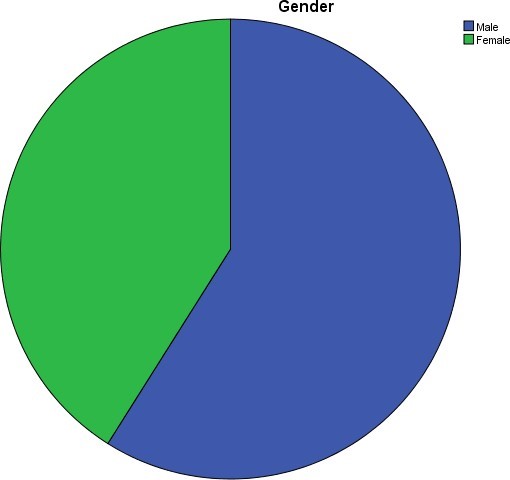
Table 1. Gender
| width="150"> Frequency width="174">Percent | > Male width="150">102 width="174">59.0 | > Female width="150">71 width="174">41.0 | > Total width="150">173 width="174">100.0 |
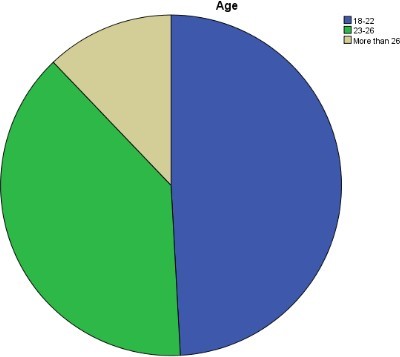
| width="150"> Frequency width="174">Percent | > 18-22 width="150">85 width="174">49.1 | > 23-26 width="150">67 width="174">38.7 | > More than 26 width="150">21 width="174">12.1 | > Total width="150">173 width="174">100.0 |
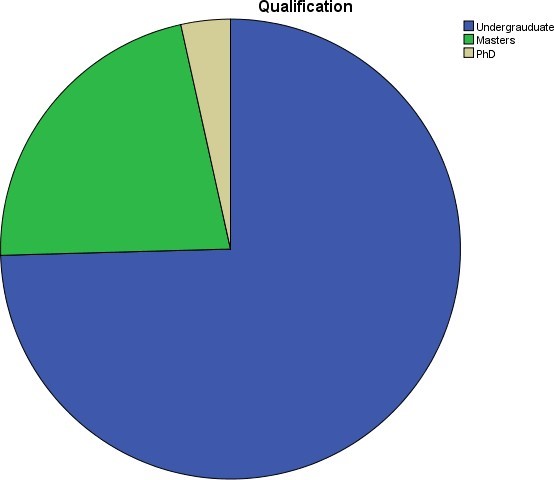
| width="150" valign="top"> Frequency width="174" valign="top">Percent | > Undergraduate width="150" valign="top">129 width="174" valign="top">74.6 | > Masters width="150" valign="top">38 width="174" valign="top">22.0 | > PhD width="150" valign="top">6 width="174" valign="top">3.5 | > Total width="150" valign="top">173 width="174" valign="top">100.0 |
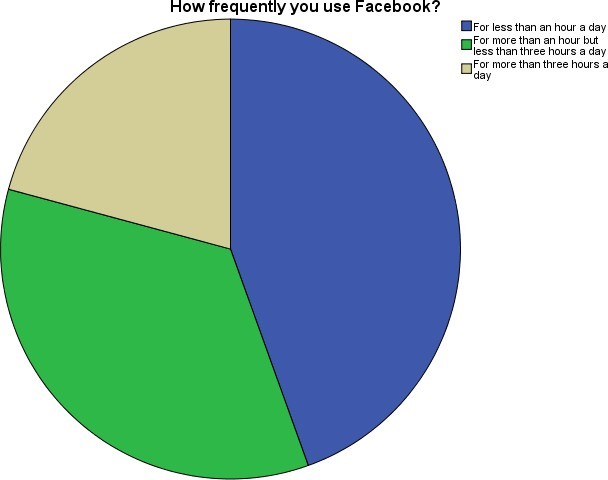
| width="104" valign="top"> Frequency width="103" valign="top">Percent | > “For less than an hour a day width="104" valign="top">77 width="103" valign="top">44.5 | > For more than an hour but less than three hours a day width="104" valign="top">60 width="103" valign="top">34.7 | > For more than three hours a day” width="104" valign="top">36 width="103" valign="top">20.8 | > Total width="104" valign="top">173 width="103" valign="top">100.0 |
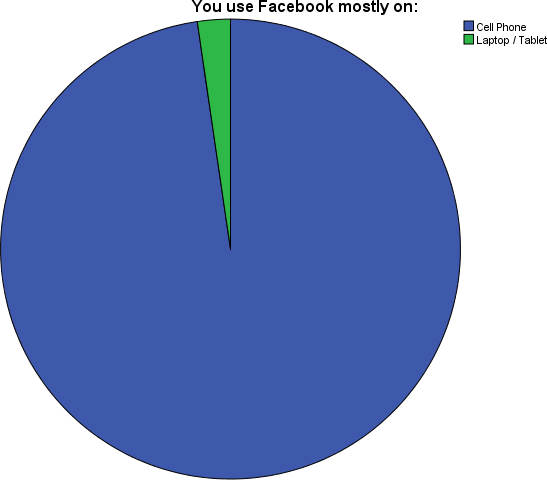
| width="194" valign="top"> Frequency width="100" valign="top">Percent | > Smart Phone width="194" valign="top">169 width="100" valign="top">97.7 | > Laptop / Tablet width="194" valign="top">4 width="100" valign="top">2.3 | > Personal Computer width="194" valign="top">0 width="100" valign="top">0 | > Total width="194" valign="top">173 width="100" valign="top">100.0 |
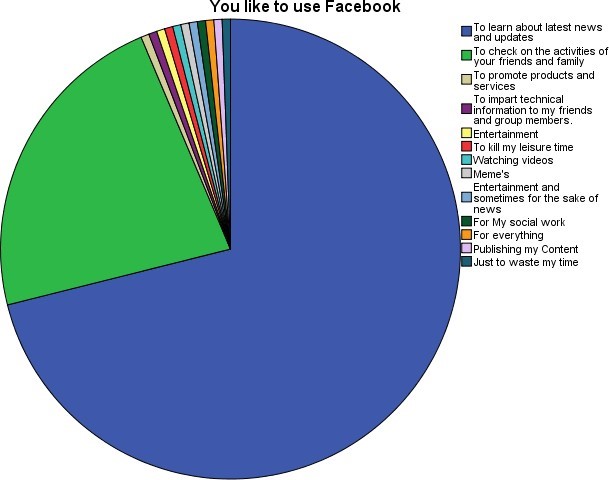
| width="72"> Frequency width="78">Percent | > To learn about the latest news and updates width="72">123 width="78">71.1 | > To check the activities of your friends and family width="72">39 width="78">22.5 | > To promote products and services width="72">1 width="78">0.6 | > To impart technical information to my friends and group members. width="72">1 width="78">0.6 | > Entertainment width="72">1 width="78">0.6 | > To kill my leisure time width="72">1 width="78">0.6 | > Watching videos width="72">1 width="78">0.6 | > Meme's width="72">1 width="78">0.6 | > Entertainment and sometimes for the sake of news width="72">1 width="78">0.6 | > For My social work width="72">1 width="78">0.6 | > For everything width="72">1 width="78">0.6 | > Publishing my Content width="72">1 width="78">0.6 | > Just to waste my time width="72">1 width="78">0.6 | > Total width="72">173 width="78">100.0 |
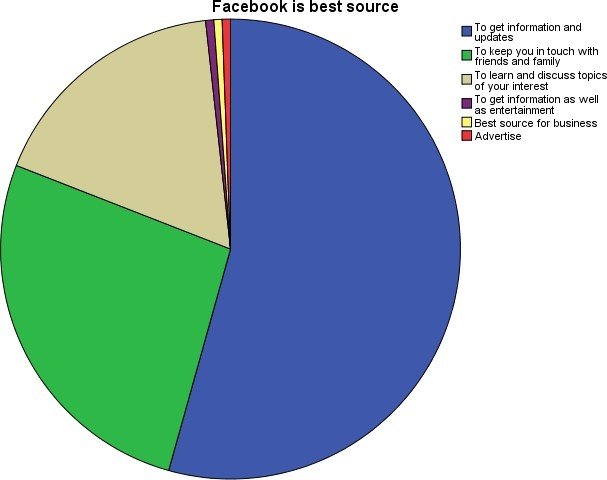
| width="105"> Frequency width="120">Percent | > Getting information and updates width="105">94 width="120">54.3 | > Keeping in touch with friends and family width="105">46 width="120">26.6 | > Learning and discussing topics of your interest width="105">30 width="120">17.3 | > To get information as well as entertainment width="105">1 width="120">0.6 | > Best source for business width="105">1 width="120">0.6 | > Advertise width="105">1 width="120">0.6 | > Total width="105">173 width="120">100.0 |
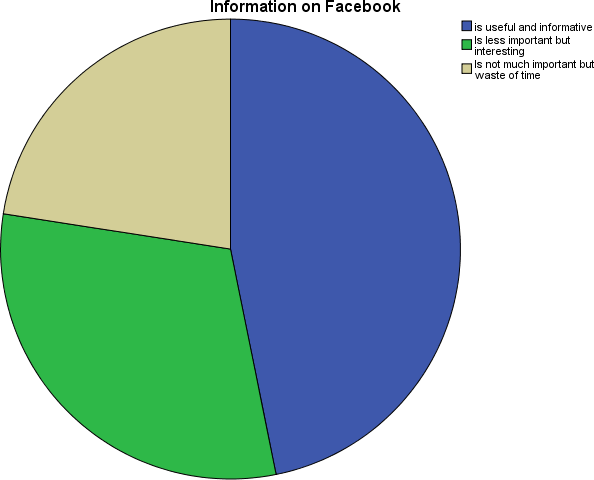
| width="121" valign="top"> Frequency width="118" valign="top">Percent | > “Is useful and informative width="121" valign="top">81 width="118" valign="top">46.8 | > Is less important but interesting width="121" valign="top">53 width="118" valign="top">30.6 | > Is not much important but a waste of time” width="121" valign="top">39 width="118" valign="top">22.5 | > Total width="121" valign="top">173 width="118" valign="top">100.0 |
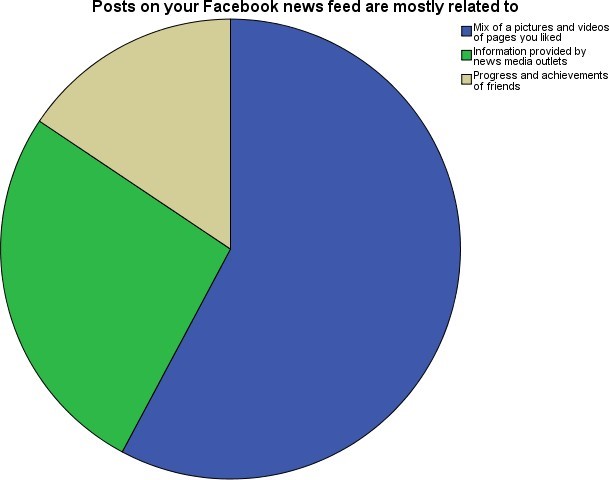
| width="126" valign="top"> Frequency width="120" valign="top">Percent | > Content from pages you liked width="126" valign="top">100 width="120" valign="top">57.8 | > News provided by media accounts pages width="126" valign="top">46 width="120" valign="top">26.6 | > Progress and achievements of friends width="126" valign="top">27 width="120" valign="top">15.6 | > Total width="126" valign="top">173 width="120" valign="top">100.0 |
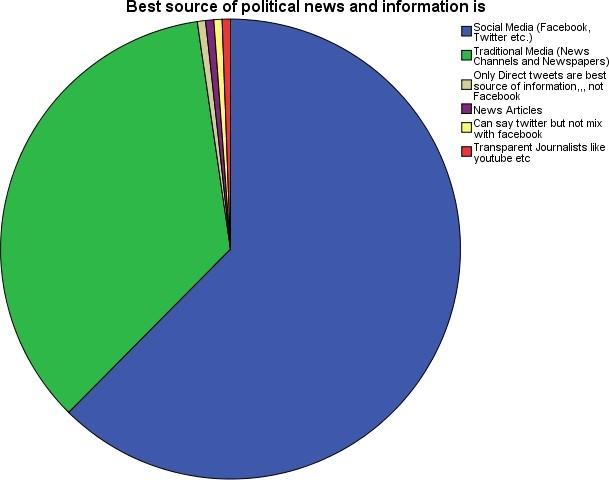
| width="98" valign="top"> Frequency width="102" valign="top">Percent | > Social Media (Facebook, Twitter etc.) width="98" valign="top">108 width="102" valign="top">62.4 | > Traditional Media (News Channels and Newspapers) width="98" valign="top">61 width="102" valign="top">35.3 | > Only direct tweets are the best source of information width="98" valign="top">1 width="102" valign="top">0.6 | > News Articles width="98" valign="top">1 width="102" valign="top">0.6 | > Can say Twitter but not mix with facebook width="98" valign="top">1 width="102" valign="top">0.6 | > Transparent Journalists like youtube etc width="98" valign="top">1 width="102" valign="top">0.6 | > Total width="98" valign="top">173 width="102" valign="top">100.0 |
| width="132" valign="top"> Frequency width="139" valign="top">Percent | > Strongly Agree width="132" valign="top">40 width="139" valign="top">23.1 | > Agree width="132" valign="top">40 width="139" valign="top">23.1 | > Neutral width="132" valign="top">48 width="139" valign="top">27.7 | > Disagree width="132" valign="top">25 width="139" valign="top">14.5 | > Strongly Disagree width="132" valign="top">20 width="139" valign="top">11.6 | > Total width="132" valign="top">173 width="139" valign="top">100.0 |
| width="157" valign="top"> Frequency width="117" valign="top">Percent | > Strongly Agree width="157" valign="top">30 width="117" valign="top">17.3 | > Agree width="157" valign="top">45 width="117" valign="top">26.0 | > Neutral width="157" valign="top">59 width="117" valign="top">34.1 | > Disagree width="157" valign="top">27 width="117" valign="top">15.6 | > Strongly Disagree width="157" valign="top">12 width="117" valign="top">6.9 | > Total width="157" valign="top">173 width="117" valign="top">100.0 |
| width="162" valign="top"> Frequency width="114" valign="top">Percent | > Strongly Agree width="162" valign="top">21 width="114" valign="top">12.1 | > Agree width="162" valign="top">45 width="114" valign="top">26.0 | > Neutral width="162" valign="top">51 width="114" valign="top">29.5 | > Disagree width="162" valign="top">27 width="114" valign="top">15.6 | > Strongly Disagree width="162" valign="top">29 width="114" valign="top">16.8 | > Total width="162" valign="top">173 width="114" valign="top">100.0 |
| width="162" valign="top"> Frequency width="114" valign="top">Percent | > Strongly Agree width="162" valign="top">32 width="114" valign="top">18.5 | > Agree width="162" valign="top">34 width="114" valign="top">19.7 | > Neutral width="162" valign="top">52 width="114" valign="top">30.1 | > Disagree width="162" valign="top">31 width="114" valign="top">17.9 | > Strongly Disagree width="162" valign="top">24 width="114" valign="top">13.9 | > Total width="162" valign="top">173 width="114" valign="top">100.0 |
| width="162" valign="top"> Frequency width="114" valign="top">Percent | > Strongly Agree width="162" valign="top">18 width="114" valign="top">10.4 | > Agree width="162" valign="top">40 width="114" valign="top">23.1 | > Neutral width="162" valign="top">46 width="114" valign="top">26.6 | > Disagree width="162" valign="top">38 width="114" valign="top">22.0 | > Strongly Disagree width="162" valign="top">31 width="114" valign="top">17.9 | > Total width="162" valign="top">173 width="114" valign="top">100.0 |
| width="162" valign="top"> Frequency width="114" valign="top">Percent | > Strongly Agree width="162" valign="top">21 width="114" valign="top">12.1 | > Agree width="162" valign="top">30 width="114" valign="top">17.3 | > Neutral width="162" valign="top">51 width="114" valign="top">29.5 | > Disagree width="162" valign="top">34 width="114" valign="top">19.7 | > Strongly Disagree width="162" valign="top">37 width="114" valign="top">21.4 | > Total width="162" valign="top">173 width="114" valign="top">100.0 |
| width="162" valign="top"> Frequency width="114" valign="top">Percent | > Strongly Agree width="162" valign="top">7 width="114" valign="top">4.0 | > Agree width="162" valign="top">30 width="114" valign="top">17.3 | > Neutral width="162" valign="top">47 width="114" valign="top">27.2 | > Disagree width="162" valign="top">46 width="114" valign="top">26.6 | > Strongly Disagree width="162" valign="top">43 width="114" valign="top">24.9 | > Total width="162" valign="top">173 width="114" valign="top">100.0 |
| width="162" valign="top"> Frequency width="114" valign="top">Percent | > Strongly Agree width="162" valign="top">12 width="114" valign="top">6.9 | > Agree width="162" valign="top">40 width="114" valign="top">23.1 | > Neutral width="162" valign="top">53 width="114" valign="top">30.6 | > Disagree width="162" valign="top">46 width="114" valign="top">26.6 | > Strongly Disagree width="162" valign="top">22 width="114" valign="top">12.7 | > Total width="162" valign="top">173 width="114" valign="top">100.0 |
| width="162" valign="top"> Frequency width="114" valign="top">Percent | > Strongly Agree width="162" valign="top">18 width="114" valign="top">10.4 | > Agree width="162" valign="top">44 width="114" valign="top">25.4 | > Neutral width="162" valign="top">50 width="114" valign="top">28.9 | > Disagree width="162" valign="top">38 width="114" valign="top">22.0 | > Strongly Disagree width="162" valign="top">23 width="114" valign="top">13.3 | > Total width="162" valign="top">173 width="114" valign="top">100.0 |
| width="162" valign="top"> Frequency width="114" valign="top">Percent | > Strongly Agree width="162" valign="top">16 width="114" valign="top">9.2 | > Agree width="162" valign="top">55 width="114" valign="top">31.8 | > Neutral width="162" valign="top">53 width="114" valign="top">30.6 | > Disagree width="162" valign="top">29 width="114" valign="top">16.8 | > Strongly Disagree width="162" valign="top">20 width="114" valign="top">11.6 | > Total width="162" valign="top">173 width="114" valign="top">100.0 |
| width="162" valign="top"> Frequency width="114" valign="top">Percent | > Strongly Agree width="162" valign="top">8 width="114" valign="top">4.6 | > Agree width="162" valign="top">23 width="114" valign="top">13.3 | > Neutral width="162" valign="top">47 width="114" valign="top">27.2 | > Disagree width="162" valign="top">43 width="114" valign="top">24.9 | > Strongly Disagree width="162" valign="top">52 width="114" valign="top">30.1 | > Total width="162" valign="top">173 width="114" valign="top">100.0 |
| width="162" valign="top"> Frequency width="114" valign="top">Percent | > Strongly Agree width="162" valign="top">11 width="114" valign="top">6.4 | > Agree width="162" valign="top">45 width="114" valign="top">26.0 | > Neutral width="162" valign="top">62 width="114" valign="top">35.8 | > Disagree width="162" valign="top">30 width="114" valign="top">17.3 | > Strongly Disagree width="162" valign="top">25 width="114" valign="top">14.5 | > Total width="162" valign="top">173 width="114" valign="top">100.0 |
| width="162" valign="top"> Frequency width="114" valign="top">Percent | > Strongly Agree width="162" valign="top">26 width="114" valign="top">15.0 | > Agree width="162" valign="top">57 width="114" valign="top">32.9 | > Neutral width="162" valign="top">55 width="114" valign="top">31.8 | > Disagree width="162" valign="top">20 width="114" valign="top">11.6 | > Strongly Disagree width="162" valign="top">15 width="114" valign="top">8.7 | > Total width="162" valign="top">173 width="114" valign="top">100.0 |
| width="162" valign="top"> Frequency width="114" valign="top">Percent | > Strongly Agree width="162" valign="top">21 width="114" valign="top">12.1 | > Agree width="162" valign="top">50 width="114" valign="top">28.9 | > Neutral width="162" valign="top">57 width="114" valign="top">32.9 | > Disagree width="162" valign="top">23 width="114" valign="top">13.3 | > Strongly Disagree width="162" valign="top">22 width="114" valign="top">12.7 | > Total width="162" valign="top">173 width="114" valign="top">100.0 |